Help & Guide/Getting started
Add an uptime monitor
Open in appProbe a URL on a schedule, independent of the store plugin.
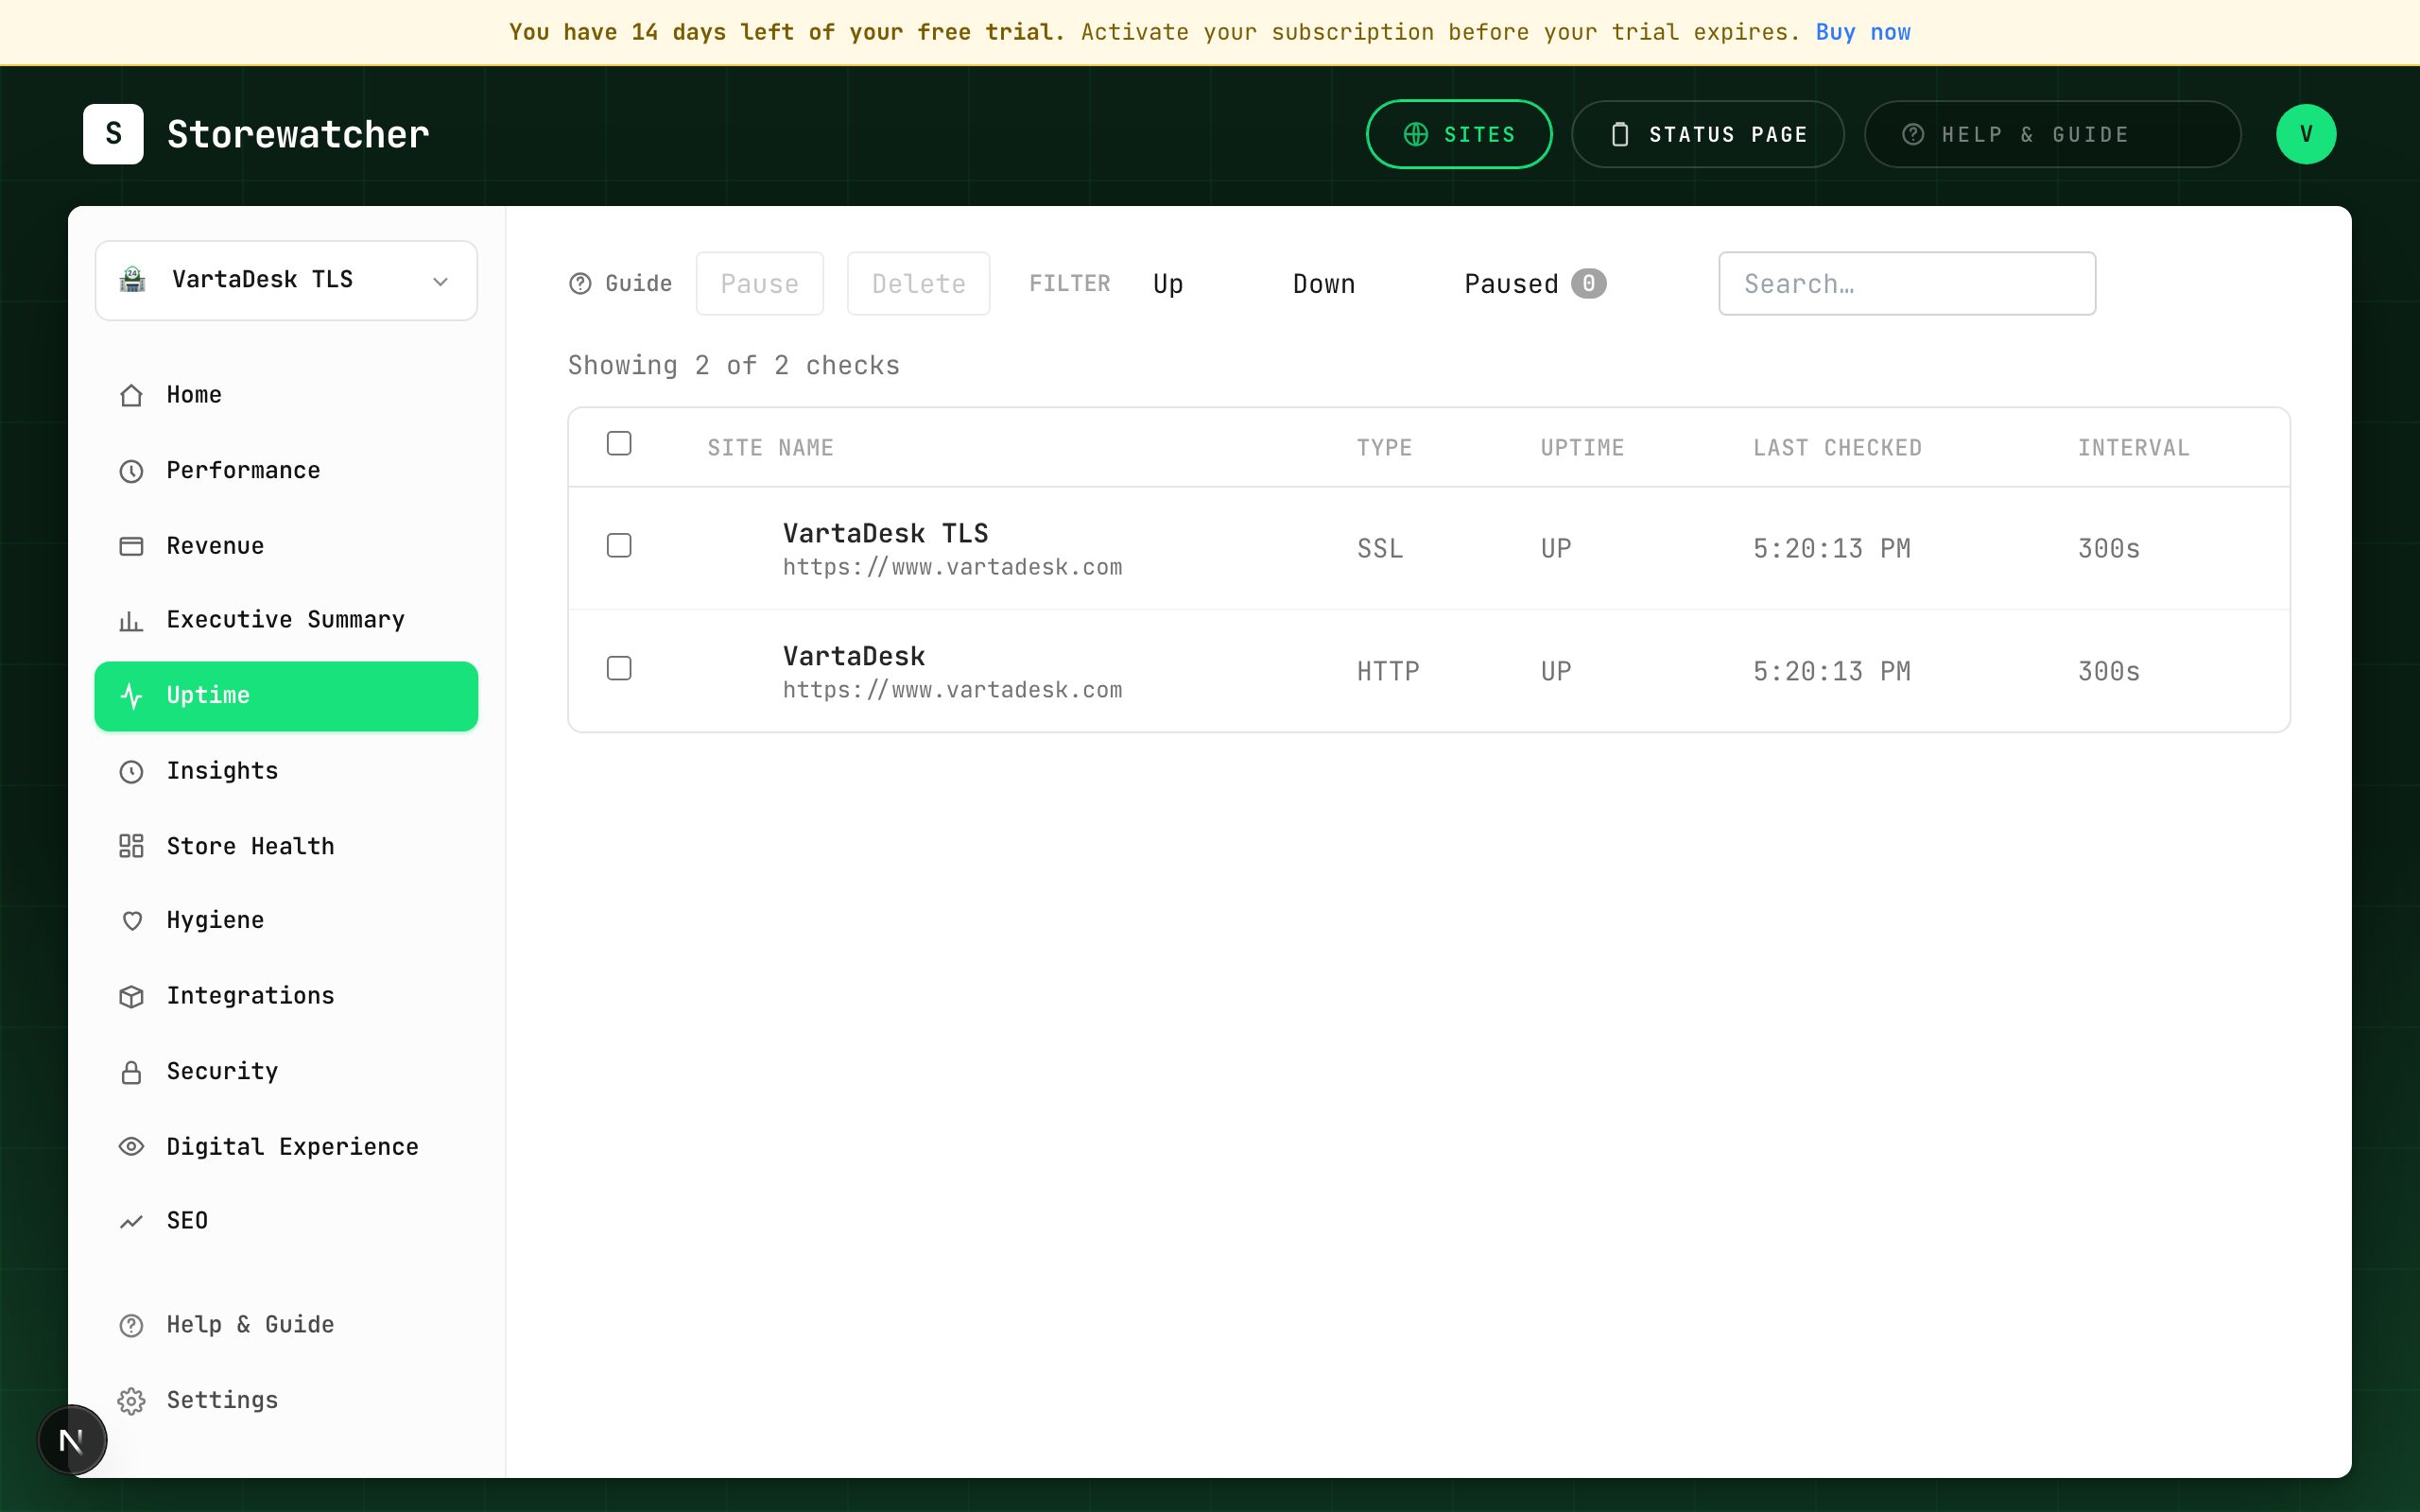
- 1Open Uptime, then Create monitor (or go to /monitors/new).
- 2Set a name and URL. Types: HTTP, API, KEYWORD, SSL, PORT, PING, HEARTBEAT, DOMAIN.
- 3Pick a check interval. Plans cap how often you can check and how many monitors you may create.
- 4Save. Open the monitor to see results, pause, delete, and per-monitor alert routing.
- 5On Uptime you can filter Up/Down/Paused and bulk-pause or bulk-delete selected rows.
KEYWORD fails if the expected string is missing from the response. SSL warns before certificate expiry (default 14 days). DOMAIN uses WHOIS for registration expiry. HEARTBEAT is push-based: your job must ping us or we alert on silence. PING is TCP reachability on 443 then 80.
An HTTP monitor alone does not unlock module-gated dashboards. Connect the store if you need Store Health or Hygiene.
Related
- UptimeAll probes, connected stores, pause and delete.
- Respond to an incidentFrom alert to ack, diagnosis, optional RCA draft, and resolve.
- Configure alertsEmail, Slack, SMS, WhatsApp, webhook, PagerDuty, plus a severity floor.
- What each plan includesGovernors for monitors, PageSpeed, RUM, checkout, insights, and AI.
Still stuck? Open a support ticket.