Help & Guide/Dashboards
Home
Open in appSnapshot of the selected site: vitals, uptime, revenue, integrations, security.
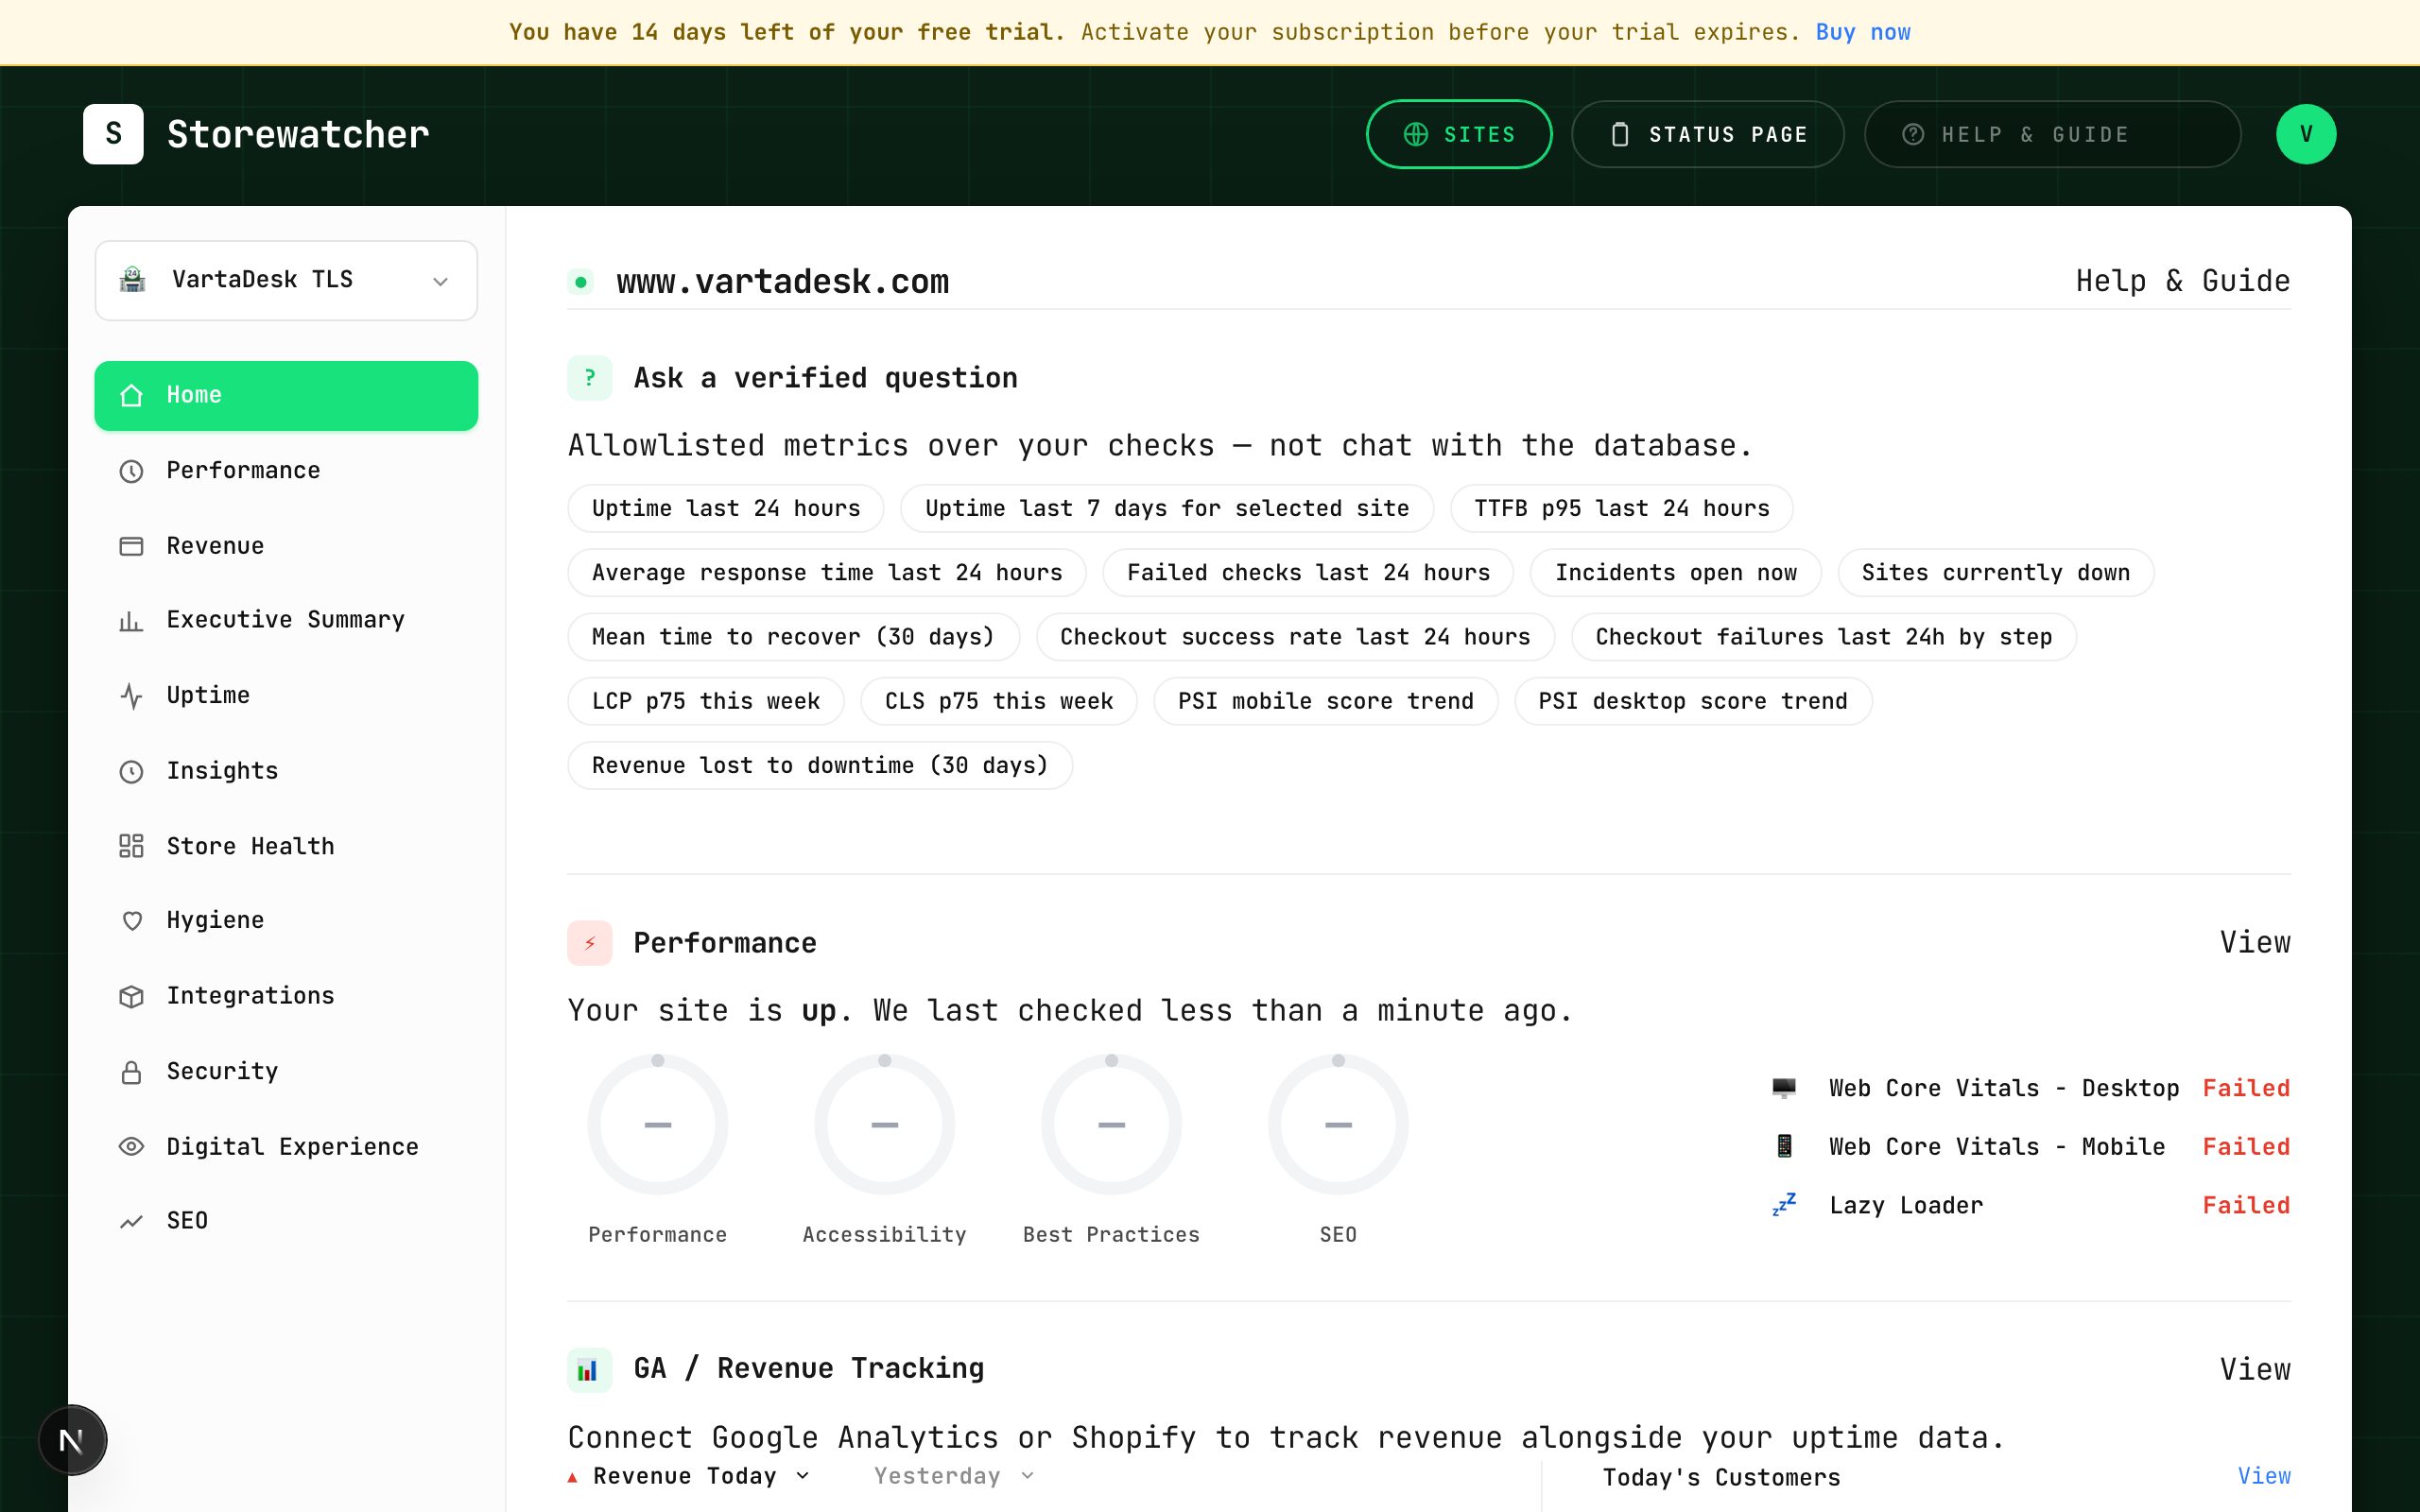
Home is the daily landing page for the site currently selected in the switcher. The live pip is availability (reachable or down). The experience pill is Google PageSpeed Insights / Lighthouse (Mobile lab by default) — missing scores say Not measured, never Failed. Uptime tiles are checks for this site only.
Origin health (CPU, RAM, disk, load) appears under Site vitals when a WooCommerce or Magento / Adobe Commerce module has synced a self-check. Shopify and BigCommerce show a hosted-platform note instead. Full history is on Store Health.
Site vitals are always-on numbers (uptime, incidents, response, failed checks). Use Ask about this site for other allowlisted questions. Guide lives in the left nav, not on Home.
Each section’s View link jumps to the full dashboard: Performance, Uptime, Revenue, Integrations, Security.
Related
- Verified questionsCanned, tenant-scoped metric questions on Home.
- Performance (PageSpeed)Lighthouse scores and Core Web Vitals for web monitors.
- UptimeAll probes, connected stores, pause and delete.
- InsightsTyped findings from detectors you already run — not a second alerting product.
- How origin health works by platformWhat CPU, RAM, disk, and load mean — and which stores can send them.
- Store HealthCPU, RAM, disk, DB, and render time from the store self-check.
Still stuck? Open a support ticket.